Path-to-Scale Research: Going Beyond Innovation

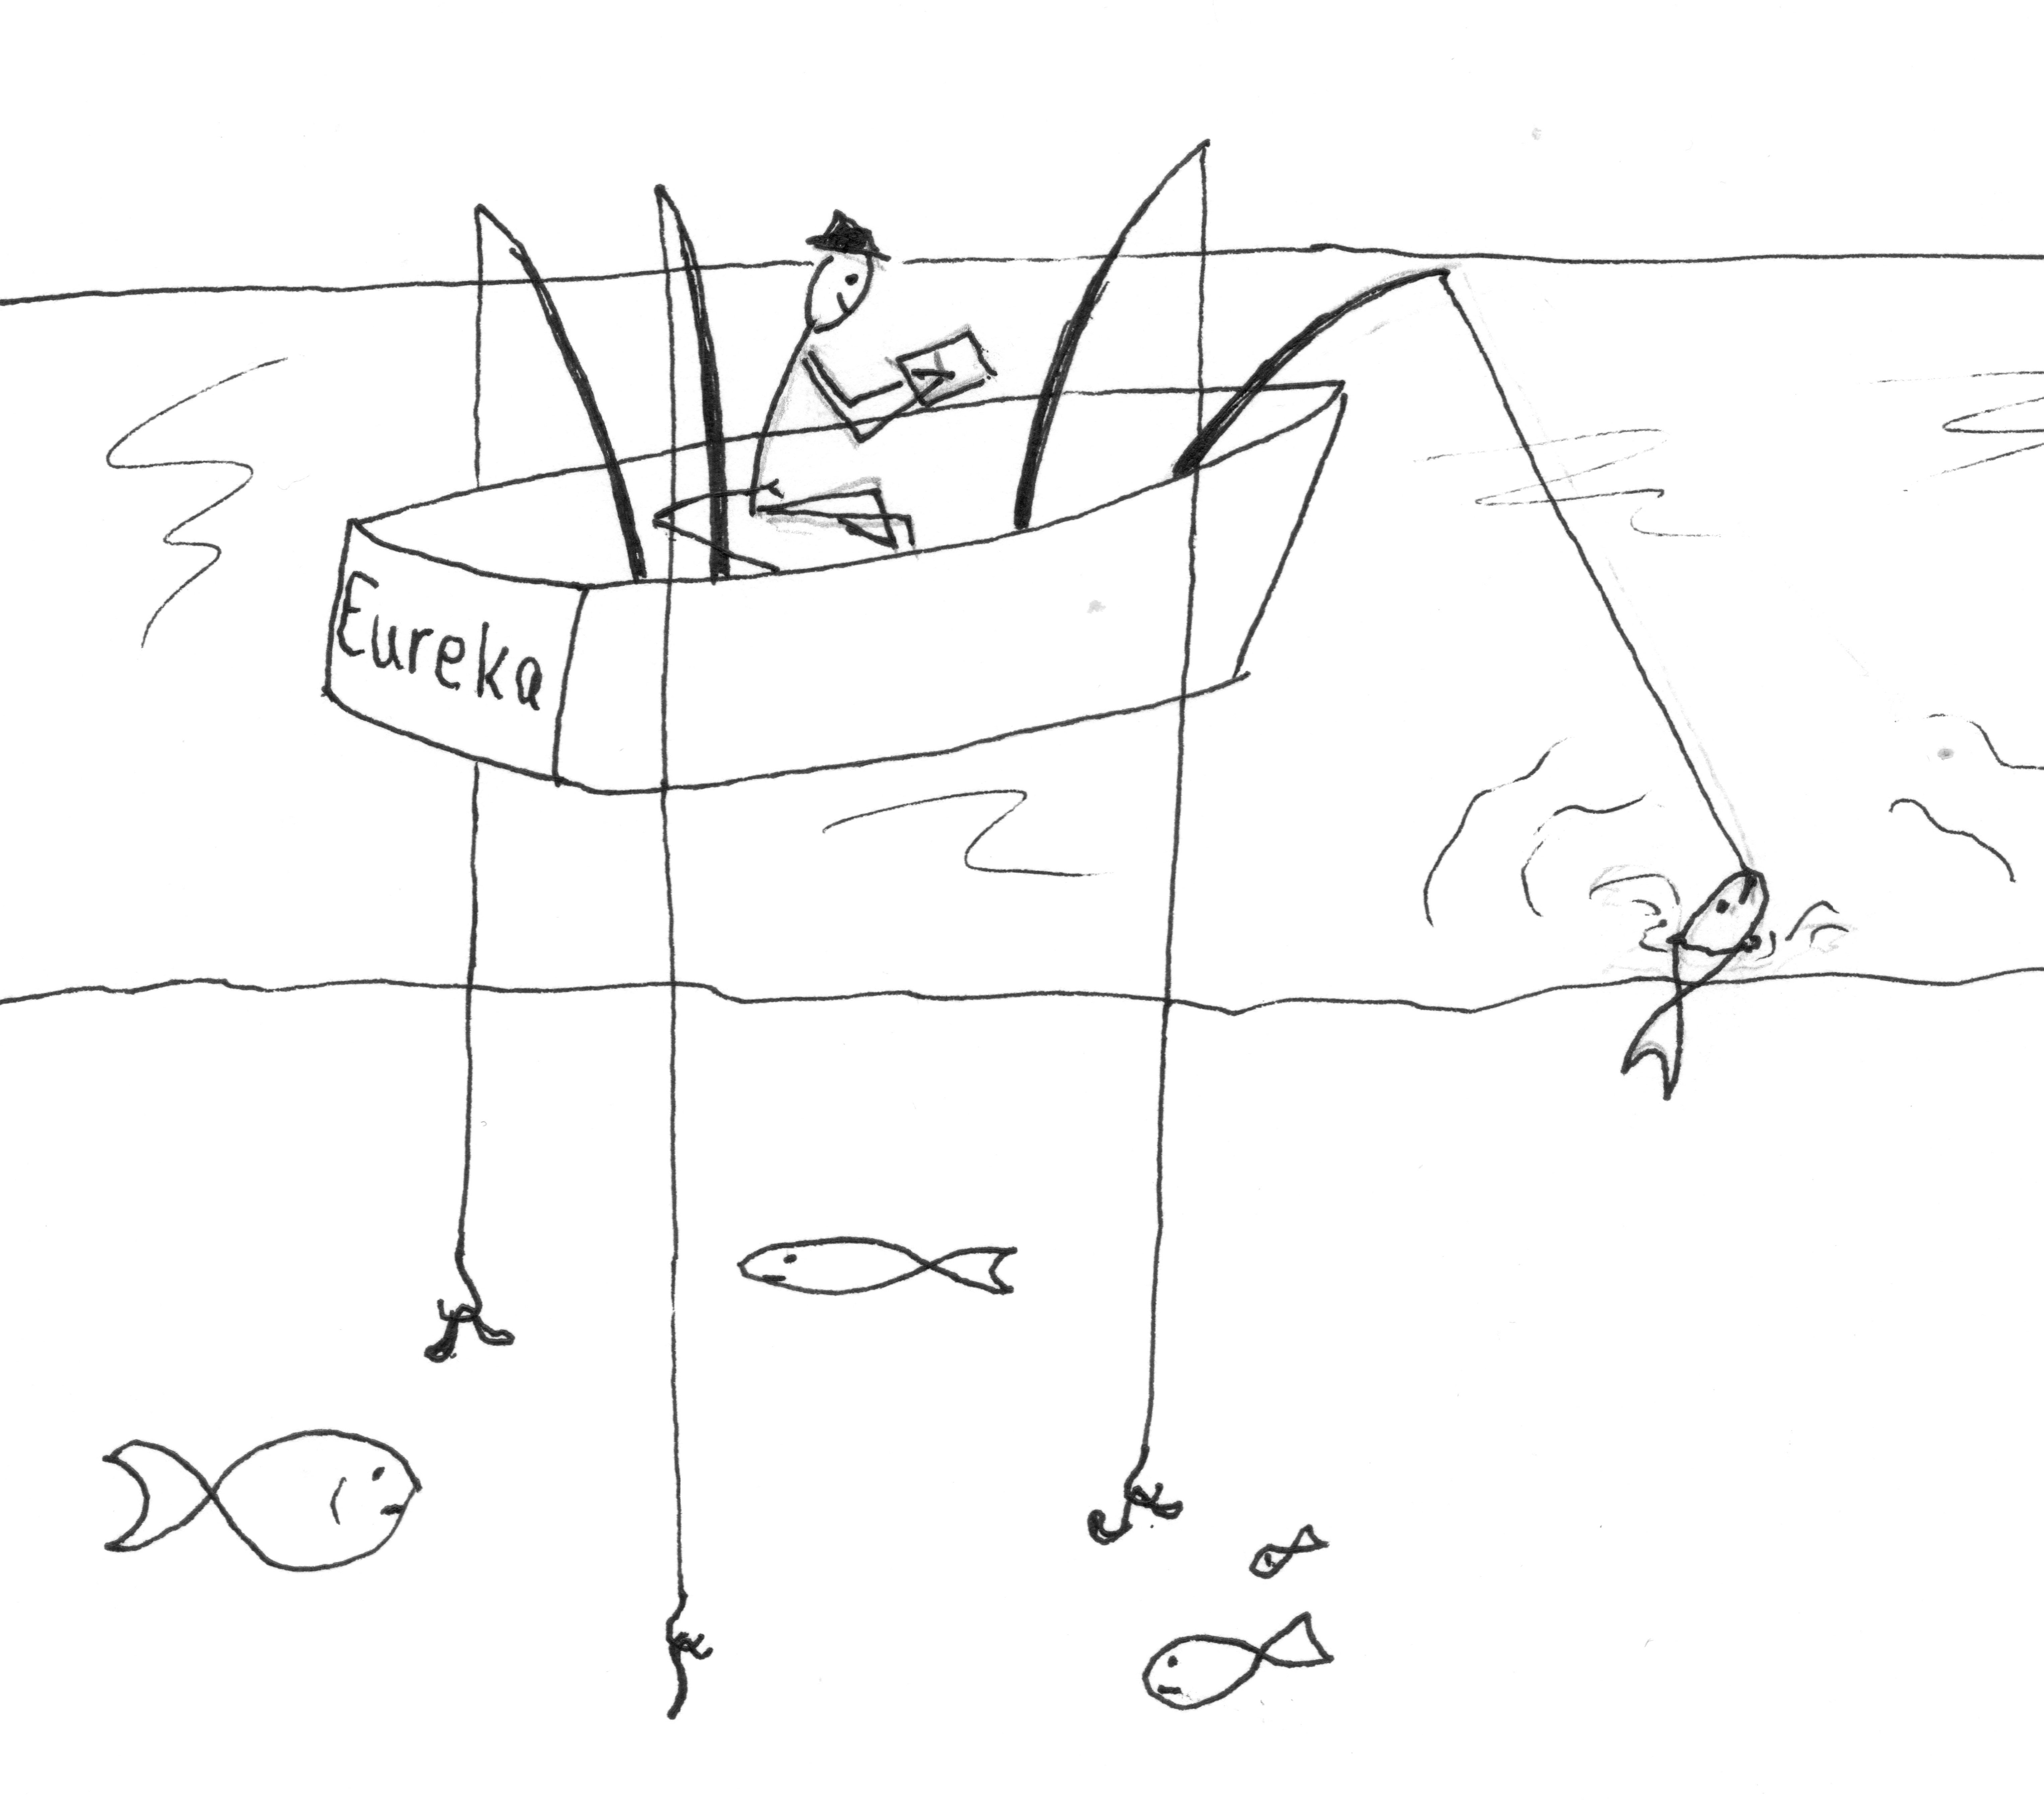
I recently came across some sketches I made a few years ago. They were crude stick-figure drawings of a fisherman in a boat with many lines in the water. But unlike a normal fisherman, this one never reeled in the fish that he hooked. His job, as he saw it, was to experiment with different bait, tackle, and techniques to see what would get fish to bite. But he never reeled them in.
When I made the sketches, I’d been working for a decade with IPA on dozens of randomized impact evaluations in Latin America and Africa, first as a research coordinator and country director and then as a principal investigator. My role was a small part of the global movement to use experimental methods to test the effectiveness of interventions designed to reduce poverty, but I was concerned we weren’t doing enough to turn the lessons from those tests into programs and policies that actually improved people’s lives. We were good at hooking fish but weren’t getting enough of them in the boat and onto plates for hungry people to eat.
...I was concerned we weren’t doing enough to turn the lessons from those tests into programs and policies that actually improved people’s lives. We were good at hooking fish but weren’t getting enough of them in the boat and onto plates for hungry people to eat.
I concede that in this comparison of fishermen to impact evaluators it isn’t fair to expect the evaluators to make sure the evidence they generate is applied to create effective programs and policies. But if it’s not their job, whose job is it? And what does it take to reel in the fish?
From Innovation to Building on Promising Approaches
In the last few years, IPA has redoubled its efforts to move promising evidence-based interventions from initial pilots to scalable and adaptable programs and policies. As anyone working in international development knows, this is a complex process. Promising results from the first impact evaluation of an intervention not only generates excitement but can also result in more questions than answers. How reliable and robust are the findings? Was the original study internally valid and adequately powered? Why did the approach work? What was the mechanism? How context-dependent was the result? Would the intervention work at a larger scale, with other implementers? How could the cost-effectiveness of the intervention be improved? And there are many more.
To systematically address these questions, we’ve started to distinguish between innovation research—proof-of-concept studies to determine if an approach works—and what we’ve been calling path-to-scale research—the broad set of additional research needed to take promising approaches from proof-of-concept to scalable programs and policies. Path-to-scale research begins with evidence-based approaches that have already shown promise in rigorous impact evaluations and builds on these promising approaches by pursuing additional evidence on how robust the original findings are, when, where, and why an approach is expected to work, and ways to optimize program design and implementation at scale. Innovation researchers hook the fish, and we use path-to-scale research to reel them in.
Building on Innovation: The Case of Growth Charts in Zambia
To illustrate this concept, let’s consider a real-life case of a fish on the line: growth charts to reduce child growth faltering in Zambia.

Günther Fink, Rachel Levenson, Peter Rockers, and Sarah Tembo tested home-based growth charts in rural Zambia to improve child nutrition and reduce stunting. The intervention was a life-size growth chart poster installed in people’s homes, color-coded to show when a child’s growth was faltering. Parents could measure their child’s height periodically and immediately see if the child’s stature was healthy, measuring in the green zone, or falling behind, indicated by red when compared to the WHO’s healthy reference population.
The researchers worked with IPA to conduct an RCT of the growth charts in eastern Zambia where nearly half of all children had stunted growth. Among children who were stunted before the growth charts were installed, the researchers found a 22-percentage point reduction in the number of children still stunted ten months later when compared to the control group. This was achieved without providing any food supplements or additional resources other than the growth charts. There was also a second treatment arm, using community-based monitoring, that had null results. You can read about both arms in the academic paper and IPA's policy note.
This is an exciting finding. The growth charts seem to have led to a reallocation of resources within the household to benefit infants and toddlers at a crucial time in their development. Inadequate nutrition in the first 1,000 days of life can cause life-long damage to a child’s developing brain and contribute to reduced productivity and wellbeing as an adult, so the reduction in stunting found in this study has the potential to have a lasting impact on these children’s lives. But what should we do with this result? Should we shout it from the rooftops and start papering people’s walls with growth chart posters in areas with high rates of stunting? If we’ve managed to hook a fish, what does it take to reel it in?
Reliability, Robustness, and Potential for Scale
To make the leap from this one study in eastern Zambia to a scalable evidence-based program, there are several questions we need to answer. First, how reliable are these findings? The study was a clustered randomized controlled trial with a total of 336 children in 85 villages split between treatment and control. That’s not tiny, but it’s not huge either. When you cut the sample down to just the households with a stunted child at baseline, it’s even smaller. So, the study method is strong, but the size of the study makes the result a bit less convincing.
We also want to know if anyone has independently verified the researchers’ work. The study was published in a peer-reviewed journal, so that’s a good start, but in addition to that, IPA’s research transparency team, which was not involved with the analysis of the study results, independently checked the research team’s analysis code to confirm that it produces the published results, which it does. They then made the data and code publicly available on the Datahub for Field Experiments in Economics and Public Policy, the secure data repository that IPA uses to publish datasets.
Once we’re convinced of a study’s reliability, there is another set of research questions to understand how robust the findings are, what the specific mechanisms are that are driving the result, whether and how the intervention could be scaled-up, and scope conditions for successful adaption to new contexts. These make up what we call a path-to-scale research agenda.
To make the leap from this one study in eastern Zambia to a scalable evidence-based program, there are several questions we need to answer. First, how reliable are these findings?...[Then] there is another set of research questions to understand how robust the findings are, what the specific mechanisms are that are driving the result, whether and how the intervention could be scaled-up, and scope conditions for successful adaption to new contexts. These make up what we call a path-to-scale research agenda.
Our Current Agenda: Building the Evidence on Growth Charts
In the case of growth charts, we worked with Günther Fink and Peter Rockers from the original study to create a path-to-scale research agenda. One set of questions was related to understanding the mechanism behind the intervention’s success. How did the study participants interact with the charts? Did parents know how to measure their children using the charts, lining them up on the appropriate age line? Did they know how to interpret the measurement? There were other elements on the growth charts not related to measurements such as aspirational images and descriptions of nutritious food options available locally. What role did these other elements play in the apparent success of the intervention?
To try to answer these questions, we conducted a qualitative follow-up study with participants from the original treatment group. We conducted fourteen focus group discussions and 25 in-depth interviews. Nearly all the houses we revisited still had growth charts on their walls three years after the study ended. We found that women were able to demonstrate correctly how to measure a child and interpret the measurement, but men were much less familiar with how the charts were supposed to be used.
Other questions in our path-to-scale research agenda include: What are the longer-run impacts of the growth charts as children grow up, and for younger siblings born after the implementation phase? Would growth charts have a similar effect if implemented across other regions of Zambia at a larger scale and if led by the government? Could an adapted version of the growth charts be effective outside of Zambia in countries with similarly high rates of child undernutrition?
Over the past year and a half, we’ve sought opportunities to pursue the path-to-scale research agenda. The push-button code replication by IPA’s research transparency team and qualitative follow-up study mentioned above were just the starting point. We’ve also secured funding for two new growth chart trials. One is in Zambia, working with the Ministry of Health to scale-up and evaluate the approach across three regions. For the second, we’ve teamed up with J-PAL Southeast Asia to adapt and test a growth chart intervention in Indonesia.
This is an example of how IPA is following up on promising evidence and trying to systematically answer questions that lead to scalable and adaptable programs and policies. If the results from the Zambia trial are positive, our government partner will be positioned to scale up the program across the country, and if the Indonesia trial demonstrates that the approach can be adapted to new contexts, we will not only look to scale the approach in Indonesia but also to introduce it in other countries grappling with persistent undernutrition and stunted development.
Path-to-Scale Research Initiatives
We are organizing these workaround path-to-scale research initiatives for specific outcomes or topics, such as child growth and development and small and medium enterprises. Each of these initiatives has three main components.
- Identifying promising evidence-based approaches to prioritize for path-to-scale research
- Creating path-to-scale research agendas for each prioritized approach
- Pursuing the research agendas by developing partnerships and fundraising for path-to-scale research projects to answer agenda questions and move evidence-based approaches to scalable solutions
In a future post, I’ll highlight our path-to-scale research initiative on child growth and development and explain what we have been doing in each of these three components. If you are a researcher or funder interested in path-to-scale research, feel free to reach out to the Path-to-Scale Research team at shenderson@poverty-action.org.


