Mobile money and other digital financial services (DFS) have emerged as game-changers for financial inclusion among millions of underserved people worldwide. Yet a critical question remains: Are these services as affordable as they claim? While DFS are often marketed as cheaper and more accessible than traditional banking, the actual fees users face, especially lower-income users, can be opaque, inconsistent, and high enough to deter regular use.
Users encounter charges at nearly every interaction point: depositing and withdrawing cash, sending money, paying bills, even checking their balances. Fee structures also vary wildly, making comparing costs difficult, with some providers charging flat fees, others using tiered structures, and others setting percentage-based fees. Many providers bury crucial pricing details in poorly designed mobile menus or on hard-to-find web pages, or simply don’t post their prices online.
As part of IPA’s Transaction Cost Index (TCI) initiative, we embarked on what should have been a straightforward task: collecting pricing information from 35 DFS providers’ websites across 16 countries. The reality was far more challenging than anticipated. Information was often missing, incomplete, or contradictory. Some providers didn’t publish comprehensive fee schedules. Others maintained multiple, inconsistent price lists, often failing to remove outdated information online.
The latest results from this price tracking work can be found in the TCI’s Year 2 Comparative Report, which expands findings documented in our first TCI report. The standardized pricing data itself is all available here. We highlight a few of the key findings drawn from both reports.
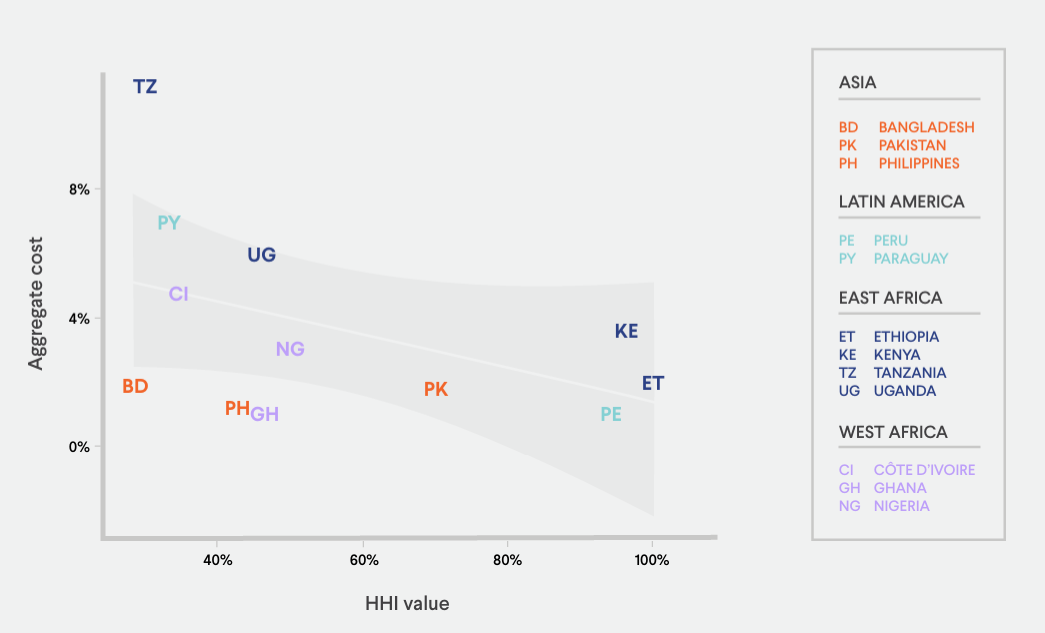
Countries with one main mobile money provider often have lower transaction costs than those with more competition. This may be because large or state-owned providers can reduce costs through scale and government influence. Tanzania, Paraguay and Uganda- among the six least concentrated markets in our study had higher transaction costs than other countries. Conversely, Kenya, Ethiopia and Peru—each dominated by a single mobile money provider— exhibit lower aggregate costs. This finding challenges the expectation that higher market concentration leads to higher prices. Several factors may explain this counterintuitive result: The dominant providers in these concentrated markets are partially state-owned, which may influence pricing strategies beyond pure profit maximization. Additionally, a single large provider can achieve economies of scale that translate to cost savings in infrastructure maintenance, agent network development, and service distribution. These efficiencies may ultimately benefit consumers through lower fees, despite the lack of competitive pressure that would typically drive prices down.
Figure 1. Average cost by Herfindahl-Hirschman Index
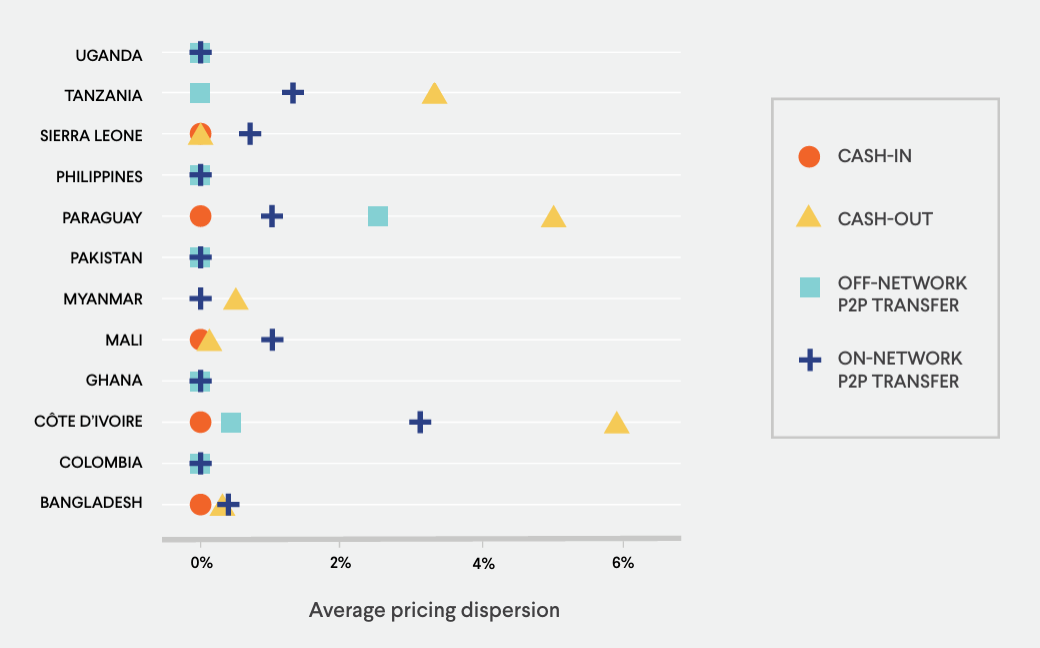
Mobile money providers within the same country tend to charge similar fees, with little variation, suggesting that competitors often match each other’s pricing, regardless of the pricing structure used. To measure price difference, we calculated the maximum range of fees charged by different providers for each transaction at a typical transaction value. When pricing is percentage-based, where users pay a flat percentage of the amount sent, competitors typically set the same transaction rates. Similarly, in slab-based pricing structures—where a flat fee applies within a predefined range— providers tend to use similar transaction value bands, and charge similar fees within each band.
Figure 2. Average pricing dispersion by country
Price transparency is a significant issue in the mobile money sector. When we searched for prices in 2023, six of the 35 providers had no fees listed on their website. Other providers created confusion by maintaining multiple, inconsistent price lists on their sites, often failing to remove outdated information when fees changed. Tax disclosure presents another transparency challenge: Out of the nine countries in our study that charge any taxes on mobile money transactions, two countries’ providers did not list the total cost, including tax.
Customer service issues remain a barrier. Providers continue to make it difficult to get in touch with them. Along with collecting price information from websites, we conducted a “sludge audit,” reaching out to each mobile money company's customer service to gauge their responsiveness, or lack thereof: two in five emails and three in ten telephone calls went unanswered. This poor customer service creates additional barriers that may deter consumers from using digital financial services.
Fee changes push consumers to keep their money in the system, reducing transfer costs and increasing cash-out fees. Across the 33 providers where we collected prices during two rounds of data collection, we observed eight providers where the total cost changed. Providers in Ethiopia and Mali reduced fees for money transfers, while Bangladeshi and Ugandan providers increased cash-out fees. In Tanzania and Ghana, taxes on transfers were reduced.
These findings suggest that some low-effort improvements to pricing disclosure could lead to large benefits. Regulations requiring firms to post up-to-date pricing information, in a standardized format, on a prominent place on the website (no more than one click away from the homepage) could help both regulators and consumers to access and assess prices, helping to boost competition. In addition, removing old, outdated price lists, especially when scattered across a website, would ensure customers receive accurate, current information. Encouraging third parties to create comparison tools with this data would help consumers make more informed decisions, further enhancing competition.
We’ve just launched a new, improved, and expanded price tracking initiative
Under the expanded Consumer Protection Research Initiative, we are enhancing our price tracking to cover more countries, transaction types, and providers. We’ll be collecting and publishing data on an interactive dashboard. The expansion is made possible by developing an automated, generative AI-powered tool for finding, collecting and standardizing pricing information. The current beta version includes 13 providers.
If you’d like to learn more about the TCI, you can watch the replay of our webinar here.
Double your impact by becoming a recurring supporter today
For a limited time, a generous anonymous donor will match first-time monthly donations up to $50K. Start a monthly plan today to double your impact while helping provide steady, sustainable support to IPA.