Using Consumer Complaint Data for Targeted Consumer Protection
What if you could use information about past customer complaints to predict who was more susceptible to fraud - and even when they would be targeted? That’s exactly what Innovations for Poverty Action (IPA) did in Uganda with the Uganda Communications Commission (UCC). Based on IPA’s research, UCC implemented a standardized complaints categorization template in October 2021 to track and categorize all consumer complaints received by mobile network operators (MNOs). This template allows UCC to monitor and analyze data from customer care records in order to:
predict future consumer protection problems and emerging issues;
measure provider performance;
highlight recurring consumer challenges;
and inform fraud prevention efforts.
To create this complaints categorization template, IPA and UCC developed new methods to analyze records from MNOs to identify trends in consumer complaints and measure MNOs’ performance in resolving complaints. We found that complaint data are relatively easy to collect and provide valuable insights on consumer protection in mobile financial services. Based on our experience, here are some strategies to maximize the value of complaint data for consumer protection.
1. Use Complaint Data to Predict Fraud Timing and Targets
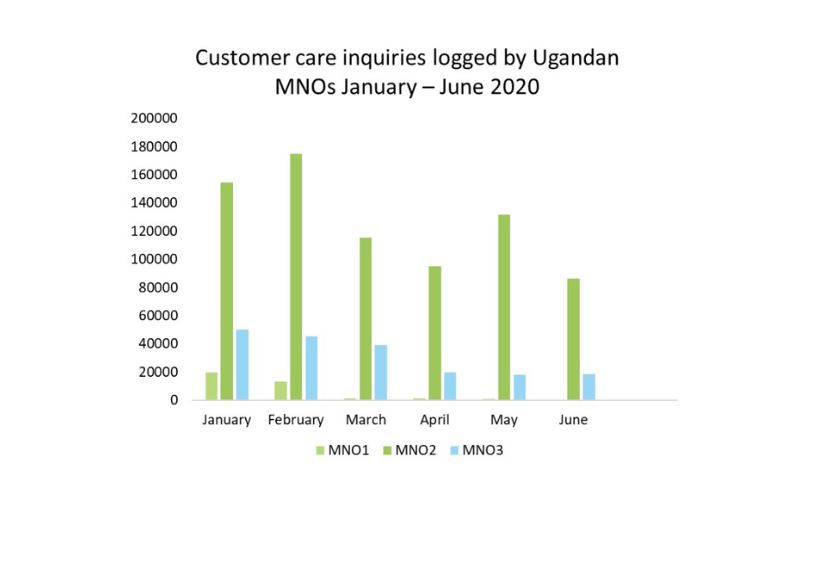
Using predictive modeling techniques where IPA analyzed all fraud-related complaints in the Ugandan MNOs’ complaint databases, we found that two of the most important determinants of fraud victims’ willingness to contact customer care were the timing of the fraud attempt and the age of the fraud target. Complaints made earlier in the day or in the middle or end of the month were more likely to be fraud-related, indicating fraudsters may be targeting certain hours or days. We also found that older people were more likely to make a fraud complaint. These data help measure not only who was a past target of fraud but also help us direct future fraud prevention efforts and better predict who might be a potential target. MNOs and regulatory bodies can focus fraud-prevention messages on certain days or hours. They can also run fraud-prevention programs specific to elderly and other identified vulnerable populations. However, as we’ll see in the next section, complaints made directly to firms are only part of the story, and may not be representative of the whole picture; not everyone knows how to or has time to file a complaint, even when something goes wrong.
Figure 1: Customer care inquiries logged by Ugandan MNOs. The finding was statistically significant at p=.01 level.
2. Complaints Logs Don’t Tell the Whole Story on Customer Complaints—Looking at All of the Data is Key
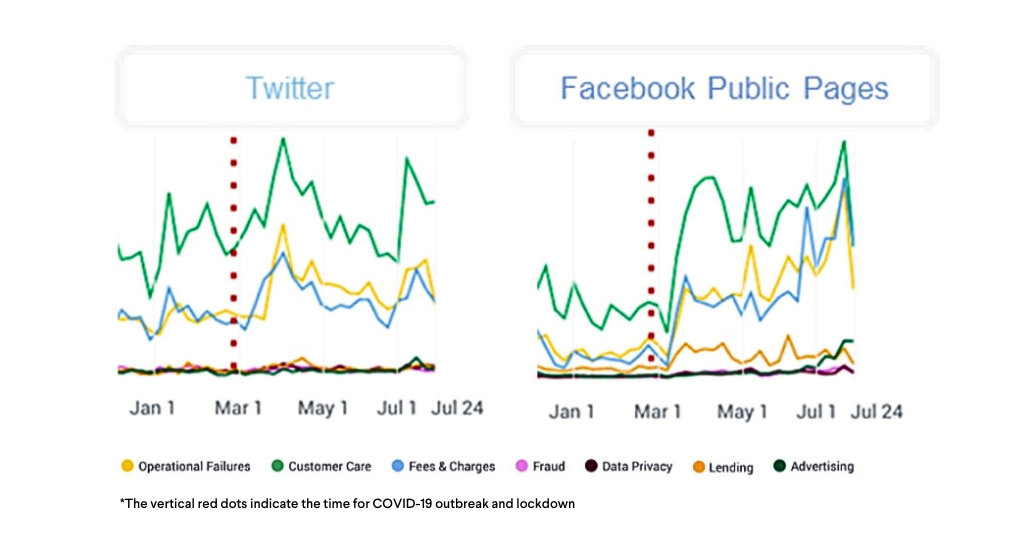
How did COVID-19 impact customer complaints? MNO customer care data alone suggest that customer complaints decreased early in the pandemic. All three MNOs showed reduced complaints between March and June 2020 as compared to January and February 2020. The reason for the decrease is not clear. One possible explanation, among many, provided by UCC is that the customer care centers were understaffed. However, social media data analysis from the same time period shows a sharp increase in social media content related to customer care and other consumer protection issues directed toward MNOs at the onset of the pandemic:
Figure 2: Proportion of consumer protection comments on Twitter and Facebook public pages by type of problems.
Additional IPA research also identified a similar pattern among fraudulent fintech apps. In other words, customer care logs don’t necessarily provide a complete picture of consumers’ experiences. If customer care hotlines aren’t available, then consumers raise their voices on social media.
Combining analysis of customer care records with other sources of consumer feedback and experiences is incredibly important to understanding the entire picture. This can be done with social media feedback or consumer surveys, similar to what UCC and IPA implemented.
3. Standardize and Expand Complaints Templates
In Uganda, the first problem we faced when analyzing complaint data was matching customer care categories from different MNOs to compare their records and build national-level indicators. Each MNO used a different system to categorize their complaints; one MNO used only 20 categories, while another used more than 18,000.
To compare the prevalence of different complaints across MNOs, we created a common system of complaints categories that all providers could use, then re-categorized existing complaints accordingly. This was done using various statistical and machine learning techniques to match and re-categorize keywords and phrases appearing in complaints. We found that standardization is key to creating a comprehensive analysis of consumer complaint data.
This led to the creation of the standardized template previously mentioned. The template was built on the existing practices of each MNO, and our experiences analyzing prior templates from each MNO. The new template standardizes key definitions, such as complaint category and type, as well as metrics like resolution rates. It also integrates demographic data such as gender, age, and location of the account presenting the complaint.
Additionally, when we added demographic information to our 2020 complaint data, we found that female subscribers were less than 35 percent of complainants, despite representing 45 percent of all subscribers nationally in 2020. Through feeding similar demographic data into analysis templates, regulatory bodies, and the industry can better identify who is more susceptible to fraud and who is typically targeted. Additionally, they can monitor the use of formal complaints channels by different populations to ensure equal access and to track issues like gender imbalance over time.
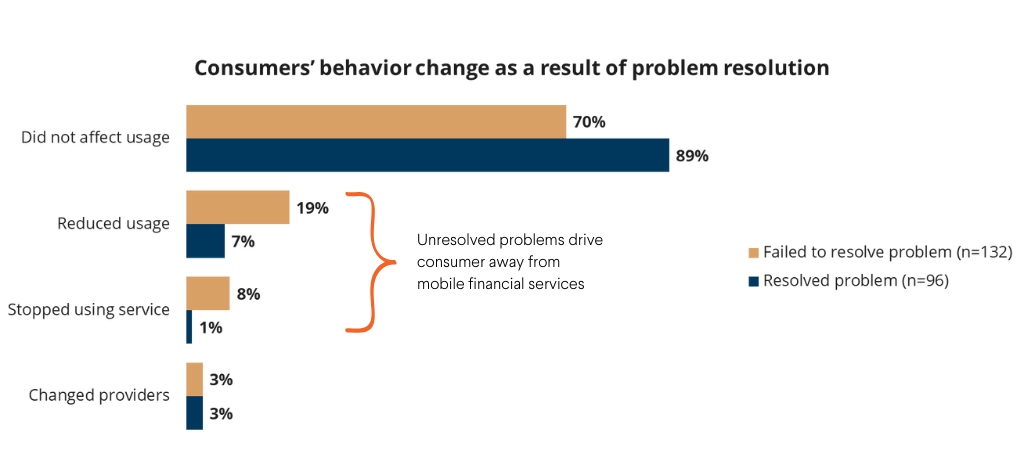
Figure 3: Percentage of consumers’ behavior change as a result of problem resolution.
In the end, if the goal is to build consumers’ trust, we need to make it easy to raise and resolve complaints. Poor redress can hinder financial inclusion and drastically impact financial behavior. As shown in Figure 3, mobile financial services users with unresolved complaints were almost three times as likely to report reducing or stopping product use than those whose problem was resolved (27%—versus those who had their problem resolved, 8%). This is why it’s essential to utilize the customer complaints data MNOs already have to create more oversight. If we harness the powerful insight these data can provide, we can improve redress channels, better predict fraud targets, and expand financial access.
Double your impact by becoming a recurring supporter today
For a limited time, a generous anonymous donor will match first-time monthly donations up to $50K. Start a monthly plan today to double your impact while helping provide steady, sustainable support to IPA.