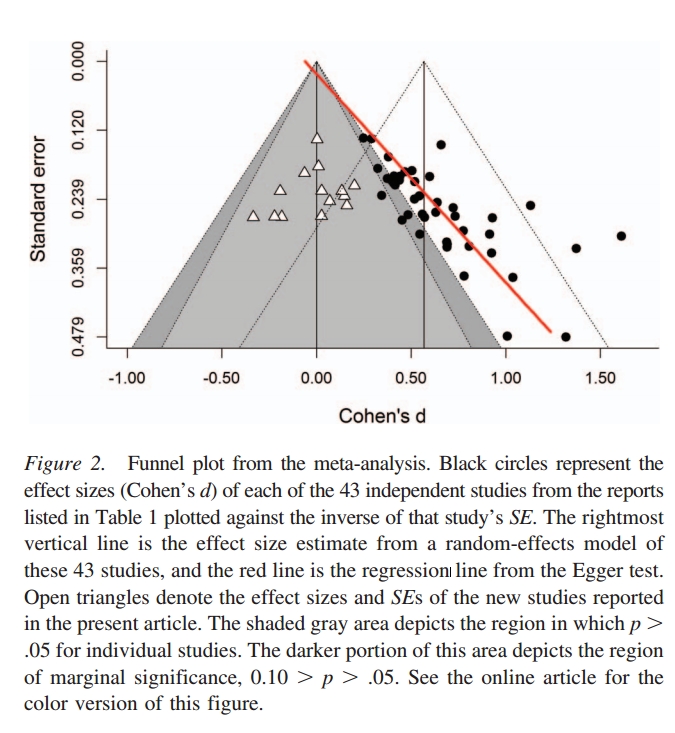
The figure below comes from
this paper, which attempts to replicate the finding that:
"A number of studies motivated by the costly signaling theory within evolutionary psychology have reported that priming inductions (such as looking at pictures of attractive opposite sex members) designed to trigger mating motives increase males’ stated willingness to purchase conspicuous consumption items and to engage in risk-taking behaviors, and reduce loss aversion."
Explanation follows the caption:
Here's a more detailed suggestion of how to read the figure from IPA-Ghana's Nathan Barker:
Basically, as the standard errors get larger you'd expect to see the effect size centered around the same mean, but with larger distance from the mean in both directions. Instead, the studies consistently are positive, and with effect sizes just large enough that their p-values are below 0.05.
Suppose we have the prior that there's no effect, which their replications suggest, then the bigger the standard errors, the larger the true effect would need to be in order to find an effect. The diagonal red line suggests that pretty much no matter what the standard errors were people happened to find effect sizes just big enough to reject the null. So instead of finding a funnel with effect sizes going in both directions as their standard errors get bigger instead they find effect sizes getting bigger, but only in one direction, and always just enough to reject the null.
I think that thinking about a few specific examples is instructive:
suppose the true effect is 0.00 and the standard errors are 0.10. Then we'd expect 95% of the studies to be between -0.196 and 0.196 in terms of effect sizes. Lo and behold, the study with these standard errors finds an effect size of 0.22, so their p-value is below 0.05, and we can reject the null.
Now suppose we have a smaller sample. We have true effect of 0.00, but let's say standard errors are 0.20. We would expect 95% of the effect sizes to be between -0.392 and 0.392. Surprise! the effect size is 0.40, so we can reject the null.

