Flipcharts and School Inputs in Kenya
Abstract
Flipcharts are thought to promote learning in several ways, and may appeal to a broader range of students with different learning styles. Flipcharts may be particularly attractive in the rural Kenyan setting, where textbooks are too expensive for most students and many students have limited proficiency in English, the medium of instruction in Kenya and the language in which all Kenyan textbooks are written.
The estimated impact of flipcharts on student test scores was found to be close to zero. A parallel non-randomized analysis estimates impacts five to ten times larger than the estimates based on the randomized trial. This suggests that the non-randomized estimates are subject to serious upward bias.
Policy Issue
While 85% of primary school-aged children are enrolled in school worldwide,1 these higher levels of enrollment may not be translated into increased learning for students in developing countries, where education quality is often low. Poor education may be due, in part, to lack of proper school materials, which are often undersupplied to poorer or more remote areas. There is a widespread belief that the provision of school materials can substantially improve educational outcomes in rural, underdeveloped areas, however there is little empirical evidence to confirm this.
Context of the Evaluation
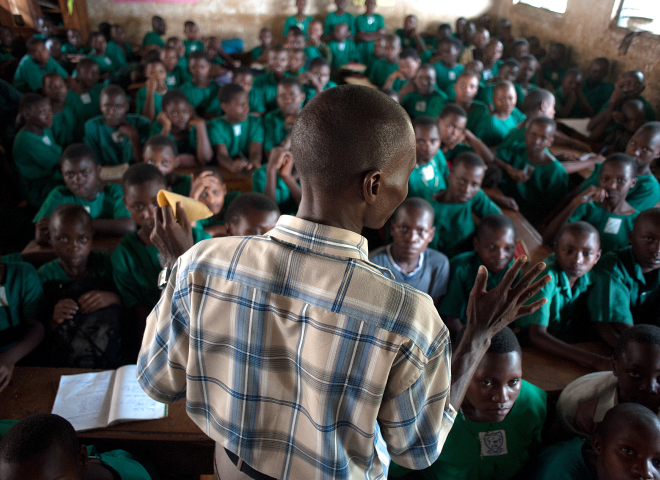
The vast majority of Kenyan children attend primary school, although in rural areas less than half complete their primary education. The schools in this study are located in Busia and Teso, two neighboring agricultural districts on the border with Uganda, both of which have below-average income for Kenya. Flipcharts and other visual aids are rare in schools in these areas, and less than one third of the schools had any flipcharts before the study. Even textbooks are rare: in grade 8, which is selective, about 40% of students had textbooks in math and English, but 15% or less had textbooks in science and other subjects. In lower grades, textbooks are even rarer.
Flipcharts are thought to promote learning in several ways, and may appeal to a broader range of students with different learning styles. Flipcharts may be particularly attractive in the rural Kenyan setting, where textbooks are too expensive for most students and many students have limited proficiency in English, the medium of instruction in Kenya and the language in which all Kenyan textbooks are written.
Most analyses of the effect of educational inputs are based on retrospective studies, which compare schools with different levels of inputs. One potential weakness of this approach is that observable inputs like textbooks and flipcharts may be correlated with unobserved variables that affect educational outcomes. For example, if parents who provide better home environments (a typically unobserved characteristic) tend to organize to obtain more observed school inputs for their children, then estimates of the effect of those school inputs on test scores may be biased upwards. This evaluation compares retrospective and prospective estimates of the effect of flipcharts in Kenyan primary schools.
Details of the Intervention
In the prospective study, a Dutch NGO, ICS, provided five sets of flipcharts—large, poster-sized charts with instructional material that can be mounted on walls or placed on easels—to each of 89 randomly selected Kenyan primary schools. The intervention included flipcharts covering mathematics, geography, health, and two charts for science (agriculture and general science), as well as a teacher’s guide for science. The charts are not kept in the classroom, but rather are brought in when they are relevant to the day’s lesson, and can therefore be used in more than one classroom on any given day. In practice, the grade 7 and 8 teachers have priority over the usage of the charts, and account for roughly 60-75% of total use.
The data available for this study are the 1997 and 1998 scores from the Kenya Certificate of Primary Education (KCPE) exam, which is taken at the end of grade 8, and the scores of grade 6-8 students on practice exams taken throughout 1997 and 1998. Test scores from schools that received the flipchart intervention were compared to the comparison group. Pre-intervention data on school performance across all subjects was also examined.
The retrospective analysis uses data for 100 schools involved in a separate study that provided textbooks and grants for flipcharts to randomly selected schools. The effect of flipcharts and other inputs was estimated using the 1998 practice and KCPE exam scores for grades 6-8.
Results and Policy Lessons
The comparison between retrospective and prospective estimates of the effect of flipcharts in Kenyan primary schools finds that randomized prospective estimates are much smaller than retrospective estimates. Despite a large sample size and two years of follow-up data, in the prospective study the estimated impact of flipcharts on student test scores was found to be close to zero.
In contrast, using the retrospective framework, several conventional ordinary-least-squares (OLS) estimates suggest that flip charts raise student test scores by 20 percent of a standard deviation. This suggests that retrospective estimates are subject to serious upward omitted variable bias, even when controlling for other observable inputs. The relationship between school inputs and educational outcomes is critical for educational policy; however policy should reflect prospective study findings as retrospective studies may produce misleading results.
Sources
1 UNICEF, “Child info, Statistics by Area/Education,” http://www.childinfo.org/education.html.


